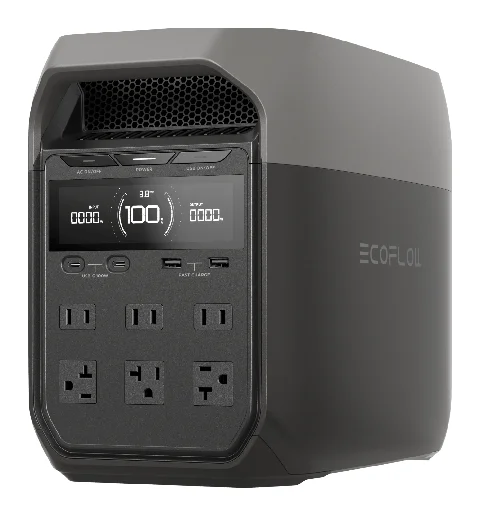
EcoFlow DELTA 3
$599 $699price read 2026-09-21
What it does
Keeps a fridge, router and phones running through a winter storm outage: 1,024 Wh, 1,800 W output, takes extra batteries.
An El Niño is under way and NOAA expects it to peak in winter 2026–27. El Niño is the biggest natural driver of record global heat, and record years land the year after a peak. This tracker shows every NOAA number, updated monthly.
Open the El Niño Station Live map, today's alerts and every NOAA update. Free, no sign-up.
In plain English: El Niño isn’t a season — it’s a warm-water pattern in the Pacific Ocean, like a fever that runs hottest in winter. Because the ocean takes months to heat the whole planet, its record-heat effect shows up the following year: a peak in winter 2026–27 is what raises the odds that summer 2027 runs hot, not the winter itself. (NOAA — the National Oceanic and Atmospheric Administration — is the official US science agency for this; its Climate Prediction Center, or CPC, is the primary source everyone else quotes.)
Data as of 2026-09-10. NOAA’s Climate Prediction Center issues its next ENSO discussion on 2026-10-08 — we refresh this page after each update. Source: CPC ENSO Diagnostic Discussion, the ONI data file and the weekly SST table.
A strong El Niño winter means more storms across the southern states and more power cuts. Power first, then the heat that tends to follow the summer after.
Every link here pays us a commission if you buy. It helps pay for the reviews. Prices show the day we read them.
EcoFlow DELTA 3
$599 $699price read 2026-09-21
Keeps a fridge, router and phones running through a winter storm outage: 1,024 Wh, 1,800 W output, takes extra batteries.
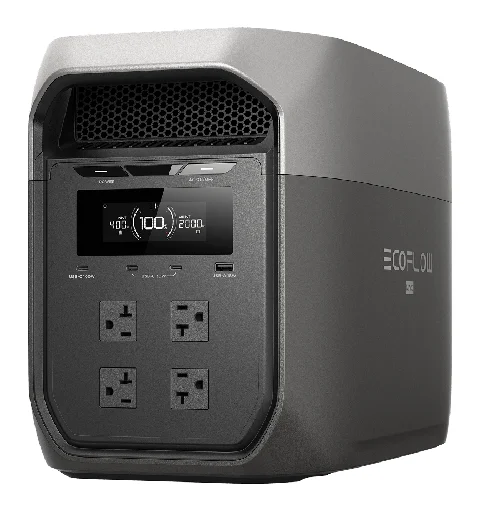
EcoFlow DELTA 3 Max
$879 $1,199price read 2026-09-21
The bigger battery for a longer outage: 2,048 Wh and 2,400 W output, so a fridge and a router run through the night, and it takes extra batteries when the storm lasts.
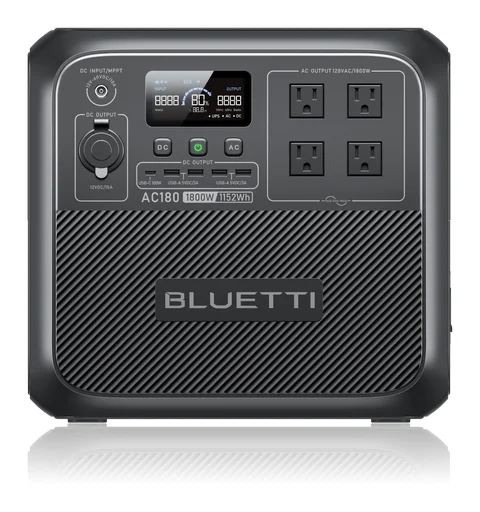
BLUETTI AC180
$499price read 2026-09-21
Check price at BLUETTIA 1,152 Wh battery with 1,800 W output: a fridge, a router and lights through a storm outage.
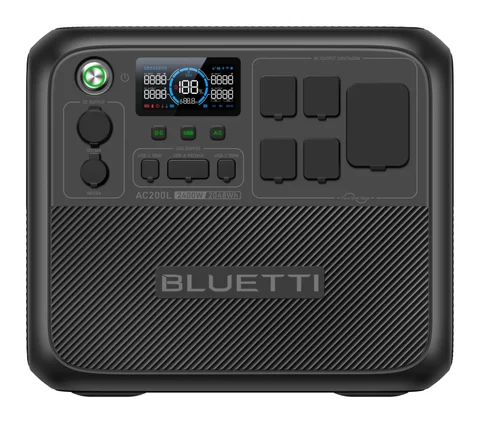
BLUETTI AC200L
$899price read 2026-09-21
Check price at BLUETTI2,048 Wh and 2,400 W output: nearly twice the AC180's capacity, for an outage that runs past the first night.
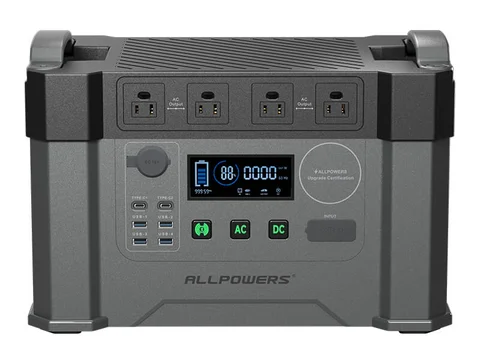
ALLPOWERS S2000 Pro
$664 $1,399price read 2026-09-21
1,451 Wh and 2,400 W output: a mid-size backup for the fridge, the router and a few lamps when the power is out.
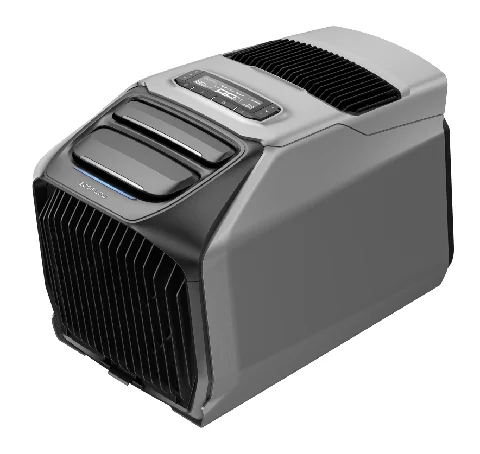
EcoFlow WAVE 3
$849 $1,299price read 2026-09-21
A 6,100 BTU air conditioner on its own battery: one bedroom, a van, or a heatwave power cut. Needs an exhaust duct out of a window.
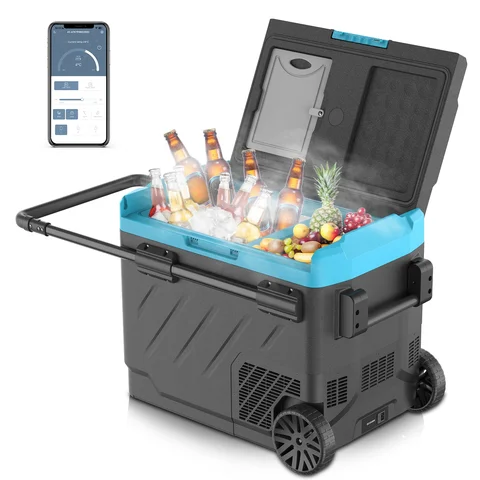
Renogy 42 Qt Portable Refrigerator (40 L)
$299.99 $499.99price read 2026-09-21
A 40 L compressor fridge that runs from a car socket or a power station: cold food and medicine in a heatwave power cut.
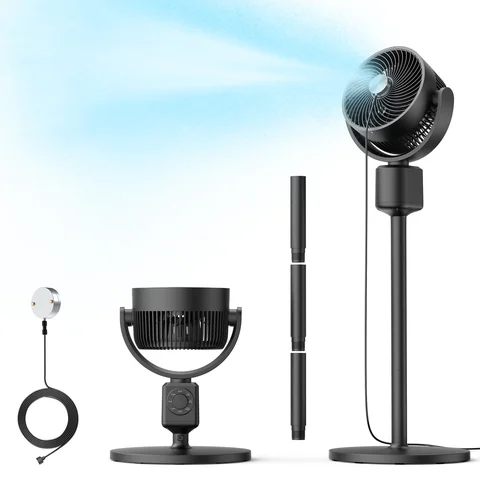
Dr.Prepare Oscillating Standing Fan with Misting Kit
$45.99 $79.99price read 2026-09-21
A standing fan with a water mist for a porch or a garage in dry heat. Mist adds humidity, so it suits dry air, not muggy air.
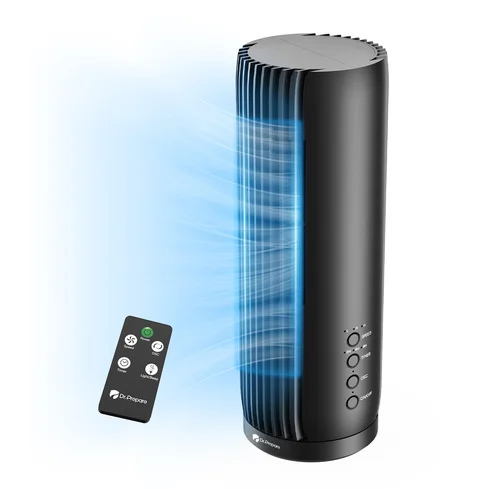
Dr.Prepare 12-Inch Tower Fan (25 W AC motor)
$29.99price read 2026-09-21
Check price at Dr.PrepareThe cheapest cooling that works in humid heat: a 12-inch tower fan on a 25 W motor moves air across a bed or a desk for under a cent an hour.
EcoFlow DELTA 3
$599 $699price read 2026-09-21
Keeps a fridge, router and phones running through a winter storm outage: 1,024 Wh, 1,800 W output, takes extra batteries.
EcoFlow DELTA 3 Max
$879 $1,199price read 2026-09-21
The bigger battery for a longer outage: 2,048 Wh and 2,400 W output, so a fridge and a router run through the night, and it takes extra batteries when the storm lasts.
BLUETTI AC180
$499price read 2026-09-21
Check price at BLUETTIA 1,152 Wh battery with 1,800 W output: a fridge, a router and lights through a storm outage.
BLUETTI AC200L
$899price read 2026-09-21
Check price at BLUETTI2,048 Wh and 2,400 W output: nearly twice the AC180's capacity, for an outage that runs past the first night.
ALLPOWERS S2000 Pro
$664 $1,399price read 2026-09-21
1,451 Wh and 2,400 W output: a mid-size backup for the fridge, the router and a few lamps when the power is out.
EcoFlow WAVE 3
$849 $1,299price read 2026-09-21
A 6,100 BTU air conditioner on its own battery: one bedroom, a van, or a heatwave power cut. Needs an exhaust duct out of a window.
Renogy 42 Qt Portable Refrigerator (40 L)
$299.99 $499.99price read 2026-09-21
A 40 L compressor fridge that runs from a car socket or a power station: cold food and medicine in a heatwave power cut.
Dr.Prepare Oscillating Standing Fan with Misting Kit
$45.99 $79.99price read 2026-09-21
A standing fan with a water mist for a porch or a garage in dry heat. Mist adds humidity, so it suits dry air, not muggy air.
Dr.Prepare 12-Inch Tower Fan (25 W AC motor)
$29.99price read 2026-09-21
Check price at Dr.PrepareThe cheapest cooling that works in humid heat: a 12-inch tower fan on a 25 W motor moves air across a bed or a desk for under a cent an hour.
Live warnings and events from official sources. El Niño changes the odds for the season. It does not cause any single heatwave, fire or storm on this map. Tap anything to see its source.
NASA EONET and NIFC can list the same fire, so one fire can show twice.
How fresh each layer is appears here once the map has read its sources.
Map data © OpenStreetMap contributors · Tiles by OpenFreeMap · Alerts: NWS/NOAA · Events: NASA EONET · Fires: NIFC · Earthquakes: USGS · ENSO: NOAA CPC · Sea-surface imagery: NASA GIBS
The Oceanic Niño Index (ONI) is a three-month rolling average of the sea-surface temperature anomaly in the tropical Pacific. Anything at or above +0.5 °C (the dashed line) is officially El Niño; below −0.5 is La Niña. Read it left (oldest) to right (now), and watch the climb out of La Niña into a strengthening El Niño.
Chart data: NOAA CPC ONI file, pulled 2026-09-10. Values are °C anomaly, oldest (left) to newest (right). Orange bars above the centre line are El-Niño-leaning; blue bars below are La-Niña-leaning. The blue bars on the left are the past La Niña, not a forecast.
NOAA classifies El Niño by the peak ONI value it reaches. The current event has already crossed into El Niño territory; the open question is how high it climbs this winter.
| Category | Peak ONI (°C) | Where we are |
|---|---|---|
| Weak El Niño | 0.5 to <1.0 | — |
| Moderate | 1.0 to <1.5 | — |
| Strong | 1.5 to <2.0 | — |
| Very strong | 2.0 and above | ← current (Jul to Sep 2026) |
Strength bands: NOAA CPC ONI strengths. A “very strong” event (peak ≥ 2.0 °C) would rank among the largest since records began in 1950.
Yes, by NOAA's index. NOAA's latest ONI, the three-month index, is +2.16 °C (Jul to Sep 2026). That is in NOAA’s very strong band, +2.0 °C or more, which this page calls super. Data as of 2026-09-10.
3 events since 1957 peaked at or above +2.0 °C on the ONI: 2014-16 (+2.59, Nov 2015 to Jan 2016), 1997-98 (+2.37, Nov 1997 to Jan 1998), 1982-83 (+2.14, Dec 1982 to Feb 1983). 1965-66, 1972-73 and 2023-24 came within 0.2 °C. The 2026-27 peak is not in yet. NOAA grades an event by the highest three-month ONI it reaches, so the final grade comes after the winter. Every strong event since 1957, on both indexes, is in the table further down this page.
A strong El Niño makes the usual El Niño winter pattern more likely, not certain. That pattern, and what El Niño does not do, is under “What this means” further down. State by state, in the 9 strong El Niño winters in NOAA’s statewide record:
These are odds from a small sample, and the spread is wide. They do not decide your winter.
Sources: the ONI data file from NOAA’s Climate Prediction Center (CPC), peaks recomputed on every data refresh (last 2026-09-02); NOAA National Centers for Environmental Information (NCEI), Climate at a Glance, statewide December to February series.
Because they are quoting different indices — and all of them are real NOAA numbers. On week of Sep 23, 2026 the published figures for this one event ranged from +1.69 to +4.7 °C depending on which region and which index you read. Here is every one of them, straight from the NOAA files.
NOAA measures the tropical Pacific in four boxes. The weekly file publishes all four; almost everyone quotes just one, without saying which.
| Region | Where it is | Anomaly |
|---|---|---|
| Niño 1+2 | far eastern Pacific, off Peru and Ecuador | +4.7 °C |
| Niño 3 | eastern equatorial Pacific | +3.9 °C |
| Niño 3.4 | central-eastern — the region NOAA headlines | +3.1 °C |
| Niño 4 | central-western equatorial Pacific | +1.1 °C |
So when a forecast says this El Niño is “three to four degrees above normal”, that is almost always Niño 1+2 — a small box off the coast of Peru — and not the region the official advisory is based on.
ONI +2.16 (Jul to Sep 2026) — the Oceanic Niño Index, the official measure NOAA declares an El Niño on.
RONI +1.69 (Jul to Sep 2026) — the Relative Oceanic Niño Index: the same measurement with the warming trend of the wider tropics subtracted, so it shows how much this event stands out from its own era.
Read plainly: on the ONI this is an El Niño; on the RONI it has not yet crossed the +0.5 °C threshold. Both indices are published by NOAA’s Climate Prediction Center from the same ocean data. NOAA declares on the ONI, so the El Niño Advisory stands and this page leads with that number. The RONI is the honest second opinion, and it is why the CPC’s own written discussion quotes cooler figures than the raw weekly file.
Regions and weekly values: NOAA CPC weekly SST table (week of Sep 23, 2026). ONI: ONI data file. RONI: RONI data file. Pulled 2026-09-10.
Not so far — and which event holds the record depends on which index you use. On the ONI, 2014-16 is the strongest since 1950 at +2.59 °C. On the RONI, 1982-83 leads at +2.40 °C. The current event peaks this winter, so it has not been written yet.
| Event | Peaked | ONI peak | RONI peak |
|---|---|---|---|
| 1957-58 | DJF 1958 | +1.69 | +1.89 |
| 1965-66 | OND 1965 | +1.82 | +1.99 |
| 1972-73 | OND 1972 | +1.84 | +1.97 |
| 1982-83 | DJF 1983 | +2.14 | +2.40 |
| 1991-92 | DJF 1992 | +1.54 | +2.12 |
| 1997-98 | NDJ 1997 | +2.37 | +2.28 |
| 2009-10 | NDJ 2009 | +1.50 | +1.50 |
| 2014-16 | NDJ 2015 | +2.59 | +2.25 |
| 2023-24 | NDJ 2023 | +1.99 | +1.42 |
Read the last two columns against each other and a pattern shows up: 5 of the 6 events before 2000 score higher on the RONI than the ONI, and 2 of the 3 events since 2000 score lower. As the whole tropical ocean warms, an anomaly measured against a fixed baseline makes a recent event look larger compared to the ocean around it. The sharpest example is 2023-24: +1.99 on the ONI (strong) but +1.42 on the RONI (moderate). That is the single best reason to treat “strongest ever” headlines carefully.
“Super El Niño” is not an official category. NOAA’s strength bands stop at “very strong” — a peak ONI of +2.0 °C or above, the table further up this page. The phrase is used widely in forecasting and in the press, but with no agreed threshold: we have seen it defined as +1.5 °C on one site and +2.0 °C on another in the same week. When you see it, check which number is meant before you act on it.
Peaks recomputed by code from the ONI and RONI data files on every data refresh (last 2026-09-02): contiguous runs of ONI ≥ +0.5 °C lasting five or more overlapping seasons, strong-and-above events only. Published peak values differ between sites — recompute from the files rather than copying them.
What El Niño reliably does: its clearest, most dependable effects in the United States are in winter, not summer — a jet stream shifted south and east tends to bring a wetter southern tier and Southeast and a milder north. NOAA’s own guidance notes El Niño’s US influence is “weak during the summer and more pronounced starting in the late fall through spring.”
What it does not do: El Niño does not cause your local summer heatwave. Any single heatwave, storm or flood has many causes, and — in NOAA’s words — a single El Niño “increases the odds” of certain patterns rather than guaranteeing them. Beware any tracker that tells you this summer will be hot “because of El Niño.” That’s not how the science reads.
Where El Niño does touch global heat is indirect and lagged: it nudges global average temperature up by roughly 0.07 °C for every 1 °C of Niño-3.4 warming, on a two-to-three-month delay. Because of that lag, the hottest calendar year on record has historically landed the year after a strong El Niño peaks — 1998, 2016 and 2024 all followed that pattern. 2024 was the warmest year since records began in 1850, at +1.29 °C above the 20th-century average.
Keep two signals separate, the way NOAA and the WMO do: the long-term warming trend from climate change is one thing; the year-to-year wobble from El Niño and La Niña is another. El Niño can amplify the impacts of a warming climate, but there’s no evidence it’s becoming more frequent or intense because of it.
Sources: NOAA Climate.gov ENSO blog and FAQ; NOAA NCEI 2024 global climate report; NWS El Niño explainer; World Meteorological Organization El Niño updates. Figures re-verified 2026-07-05.
An Extreme Heat Warning is the National Weather Service's most serious heat alert — issued when dangerously hot conditions are expected or occurring in an area. In 2025 the NWS renamed its top-tier heat alert from "Excessive Heat Warning" to "Extreme Heat Warning"; both names mean the same thing, and the map colors them the same deep red. One tier down sit the orange Extreme Heat Watch (dangerous heat is possible) and the yellow Heat Advisory (hot enough to be risky, especially for vulnerable people). Every alert on the map links to its official NWS zone page — treat that page, not us, as the instruction.
Six official sources, nothing else: NWS/NOAA active alerts (api.weather.gov), NASA EONET open events, National Interagency Fire Center (NIFC) wildfire incidents, US Geological Survey (USGS) earthquakes, NOAA CPC ENSO data, and NASA GIBS daily sea-surface temperature anomaly imagery. The alert, event, fire and quake layers are read from those sources by this page, and the lines under the map say per layer when the read happened and whether it worked. A failed alert or event read shows our backup copy with its bake time and age, never silently. Fires and quakes have no backup copy, so a failed read says it failed. The ENSO figures carry the date NOAA issued them and are put on the page by a person; the news list carries its own dates; the NASA sea-surface imagery is served as tiles by NASA itself.
No — and that's the point of the framing line above the map. El Niño shifts the odds of seasonal patterns; no single heat warning, fire or storm can honestly be attributed to it. The alerts layer and the ENSO layer are shown together because both shape your summer, not because one causes the other.
Yes, freely, with a link — the citation box above the FAQ has a copy-ready reference. If you need the raw data, go straight to the official sources: they publish everything we show.
Because they are quoting different indices without saying which. NOAA measures four regions of the tropical Pacific and publishes two seasonal indices, and on the same day they can range from about +0.5 to +3.8 °C for the same event. The number the official advisory rests on is the ONI, a three-month average of the Niño 3.4 region. A headline saying “three to four degrees above normal” is usually quoting Niño 1+2, a small box off Peru. The full breakdown, with every current value, is in the section above.
They are the tiers of NOAA’s ENSO Alert System, and they mean different things. An El Niño Watch means conditions are favourable for an El Niño to develop within the next six months — a heads-up, not a declaration. An El Niño Advisory, which is what is in force now, means El Niño conditions are actually present and expected to continue. A Final El Niño Advisory is issued when the event is ending. There is also a La Niña equivalent of each, and “ENSO-neutral” when neither is active.
There is no official answer, because “super El Niño” is not an official NOAA category. NOAA’s published strength bands stop at very strong, meaning a peak ONI of +2.0 °C or above. The term is common in forecasting and the press but carries no agreed threshold — it is defined as +1.5 °C in some places and +2.0 °C in others. What NOAA has actually said (CPC, 2026-09-10) is that there is a greater than 90% chance this event reaches very strong during Northern Hemisphere fall and winter 2026–27 — and a 75% chance that October–December 2026 brings a historic event, one exceeding every El Niño back to 1950 (+2.5 °C or more, 3-month RONI). Those are odds, not a forecast.
Where the latest reading sits against the super line, and every past super event: Is 2026-27 a super El Niño?
NOAA’s latest forecast, issued 2026-09-10: an El Niño Advisory is in force and the event is strengthening. NOAA gives a greater than 90% chance of a very strong El Niño during fall and winter 2026–27, and a 75% chance that October–December 2026 brings a historic event (+2.5 °C or more, 3-month RONI). The latest three-month index, the ONI, is +2.16 °C for Jul to Sep 2026. NOAA’s next forecast update is due 2026-10-08, and this page is refreshed after it.
These are odds for a season. They are not a forecast for your town, and the map on this page shows today’s official warnings, not a prediction.
The timeline so far: NOAA issued its El Niño Advisory on 2026-09-10, the latest three-month ONI is +2.16 °C (Jul to Sep 2026), and NOAA gives a greater than 90% chance of a very strong event during fall and winter 2026–27. Every strong El Niño in NOAA’s record since 1957 peaked between October and February. NOAA updates its outlook once a month, next on 2026-10-08.
The heat comes later than the peak. Record warm years have tended to land the year after an El Niño peaks, which is why a peak in winter 2026–27 raises the odds for summer 2027.
A strong El Niño tilts the odds for winter. It does not decide it. The usual pattern is a wetter southern US and a milder northern US, and a stronger event makes that pattern more likely, not certain. What the past strong El Niño winters did state by state is under Is 2026-27 a super El Niño?, and the full pattern, with what El Niño does not do, is in “What this means” above.
Why this matters for heat: a peaking El Niño is the clearest early signal we get that the following summer carries elevated record-heat odds — so the sensible move is to be ready before demand and prices spike, not during a July heatwave. If a strong El Niño winter is coming, the useful response isn’t panic-buying an air conditioner today — it’s ordinary preparedness. If you’re in the wetter southern tier, that means drainage, sump pumps and storm supplies. Everywhere, it means knowing the heat-safety basics for the summer you’re actually in right now.
NOAA puts out an El Niño update once a month. We'll email you when it does and tell you what changed. Unsubscribe any time.